Thank you to Mark Settle for sharing his articles and expertise on our platform.
True Consequences of SaaS Sprawl: A Real World Study
by Mark Settle and Tomer Y. Avni

The SaaS revolution began in 1999 when Marc Benioff founded Salesforce.com. Salesforce went public in 2004 after achieving $96M in annual sales. Sixteen years later it was added to the Dow Jones Industrial Average after reporting revenues of $17.1B in fiscal 2020. SaaS is no longer a revolutionary concept. It’s been embraced as a foundational IT building block within companies of all sizes, all industries and all geographies.
SaaS sprawl is a natural consequence of the SaaS revolution. An analysis of Okta’s 2020 customer database revealed that companies employing 2,000 or more individuals maintained an inventory of 175 SaaS apps on average. A similar survey conducted by Blissfully in 2019 indicated that firms employing more than 1,000 individuals used 288 SaaS apps on average. And finally, two-thirds of the companies included in Productiv’s 2021 SaaS Management survey employed 100 or more SaaS apps. By any measure, SaaS apps have become a conspicuous and pervasive component of every company’s digital landscape.
The numbers quoted above fail to convey the true sprawl created by widespread SaaS adoption. SaaS definitions vary from one company to the next and may include a combination of personal productivity tools, business applications, data services, collaboration tools, security services, AI/ML modeling platforms, etc. Multiple user accounts are established for each SaaS service. User identities are not limited to full time employees but will inevitably include a wide variety of temporary employees, external contractors and service providers and even nonhuman robots or devices. Authorization policies are instituted to control the actions that users can perform within their accounts on specific IT assets. Consequently, the number of SaaS apps employed within an enterprise is just the tip of a bigger administrative iceberg created by the multiplicative sprawl of user identities, accounts and asset-specific policies.
This article reports the results of a study performed earlier this year to illustrate the multiple dimensions of SaaS sprawl. The data employed in this study was provided by Authomize, a security company that employs AI technology to profile relationships between user identities, IT assets and authorization policies across an enterprise. All of the data employed in this study was provided and handled on an anonymized basis.
Methodology
The implications of SaaS sprawl were initially evaluated in over a dozen enterprises. Four were ultimately selected to illustrate the knock-on effects of SaaS adoption. The companies discussed in this article ranged in size from 700 to 3,000 paid employees (subsequently referred to as PEs, which includes both full-time and part-time employees on a company’s payroll). These companies are based in the U.S. and Europe and were founded 5 to 25 years ago. They’ve experienced the SaaS revolution firsthand. Although they may not be purely cloud native firms, SaaS services play a dominant role in supporting their daily business operations. These companies operate in four distinctively different industries: oil & gas, EdTech, financial services and enterprise software. Throughout the remainder of this article these four firms will be referred to as ‘the study companies’.
The knock-on effects of SaaS sprawl
SaaS sprawl is commonly conceived to be a reference to the number of cloud-based SaaS services being employed by an enterprise. In reality, it is a much broader phenomenon.
Service sprawl. The number of unique SaaS services being accessed by the Identity Provider (IdP) databases within the study companies ranged from 310 to 994. This is significantly higher than the SaaS counts reported in the studies cited above and likely includes cloud-based services that would not be strictly classified as business applications. This study was based on the broadest possible definition of SaaS services, excluding only IaaS vendors.
The ratio of unique SaaS services to employees ranged from 1:1 in the smallest (700 PE) company to 1:3 in the largest (3,000 PE) company. However, these ratios were not correlated with company size. The 2,500 PE firm included in this study had a 1:8 ratio of services to employees.
Identity sprawl. The number of unique identities within the IdP databases of the study companies ranged from 2,197 to 13,062, significantly higher than the number of PEs within each company. IdP identities include not only PEs but also external contractors, vendors, managed service providers, go-to-market partners, etc. as well as nonhuman agents such as software bots and devices.
Once again there was no correlation with company size. The ratio of IdP identities to PE headcount was 3:1 in both the smallest and largest company included in this study. The highest ratio – slightly greater than 6:1 – was observed within the 800 PE firm.
Account sprawl. An account enables users to access a SaaS service and perform certain activities. Users may possess more than one account for an individual service. Each account will enable a certain range of activities to be performed. The number of unique accounts maintained within the study companies ranged from 6,333 to 15,681.
The number of unique accounts was generally 10-30% higher than the number of unique identities. The one exception was the largest company in the study (3,000 PEs) in which the number of unique accounts was 30% lower than the number of identities.
The term ‘service account’ is conventionally used to refer to accounts that possess specialized privileges that are only accessible to SaaS administrators or superusers. IT groups strive to minimize these types of accounts to reduce operational complexity and limit security vulnerabilities. It’s interesting to note that the largest and smallest study companies each maintained roughly 840 specialized service accounts. In the largest company this represented 13% of all existing accounts. In the smallest company it represented 38%, a dangerously high proportion.
Policy assignment sprawl. Assets are IT resources such as application objects, data tables, document files, etc. that users can view, modify, copy, share, etc. Users access assets via their accounts. Policies control a user’s ability to access specific assets as well as the actions they can perform once access has been gained. The number of policy assignments governing asset utilization within the study companies ranged from 38,746 to 1,676,774.
Note that policy assignments don’t represent unique policies being maintained by individual companies. They represent unique associations between specific policies, user accounts and IT assets.
The largest number of policy assignments was observed within the 2,500 PE enterprise software firm. The smallest number was observed within the 700 PE EdTech firm. However there was no obvious correlation with company size. The 800 PE financial services firm maintained 744,849 identity and asset-specific policy assignments, almost 20 times the number maintained by the slightly smaller 700 PE EdTech firm.
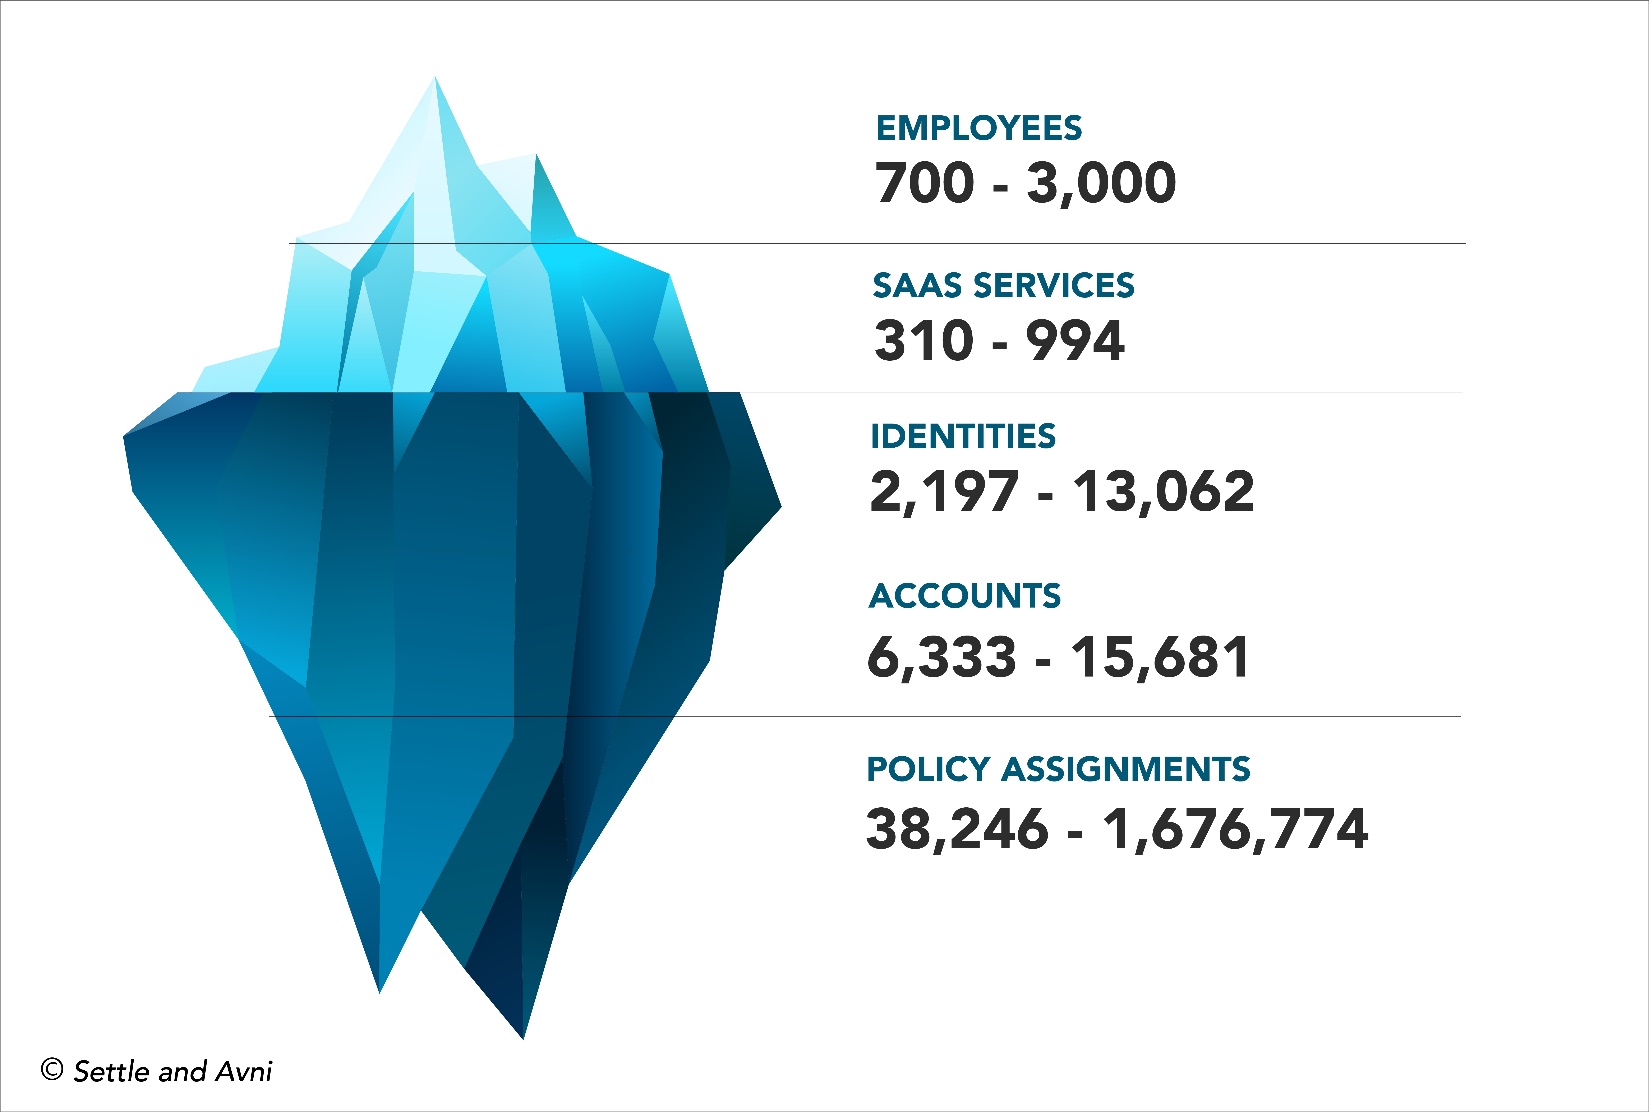
Figure 1. The administrative iceberg of user identities, accounts and asset-specific policy assignments created by SaaS sprawl within the four companies analyzed in this study.
Figure 1 illustrates how misleading discussions of SaaS sprawl can actually be. The proliferation of SaaS services that is observed by end users and bemoaned by many industry prognosticators is only the tip of the administrative iceberg created by large scale SaaS adoption. SaaS at Scale almost inevitably results in administrative headaches, end user friction, unanticipated costs and security vulnerabilities that catch many companies off guard.
Missing the security mark
The sampling of companies employed in this study is too small to draw any global conclusions about best practices that should be followed in deploying SaaS services at scale. However, some general observations about administrative complexity and security vulnerability can be made by considering the aggregate impact of the sprawl metrics discussed above.
Figure 2 displays the four sprawl indices – services, identities, accounts and policy assignments – normalized to the number of PEs within each study company. It’s readily apparent that there’s no consistent correlation between sprawl characteristics and company size. However, it’s equally apparent that some companies have been more effective at curbing sprawl than others.
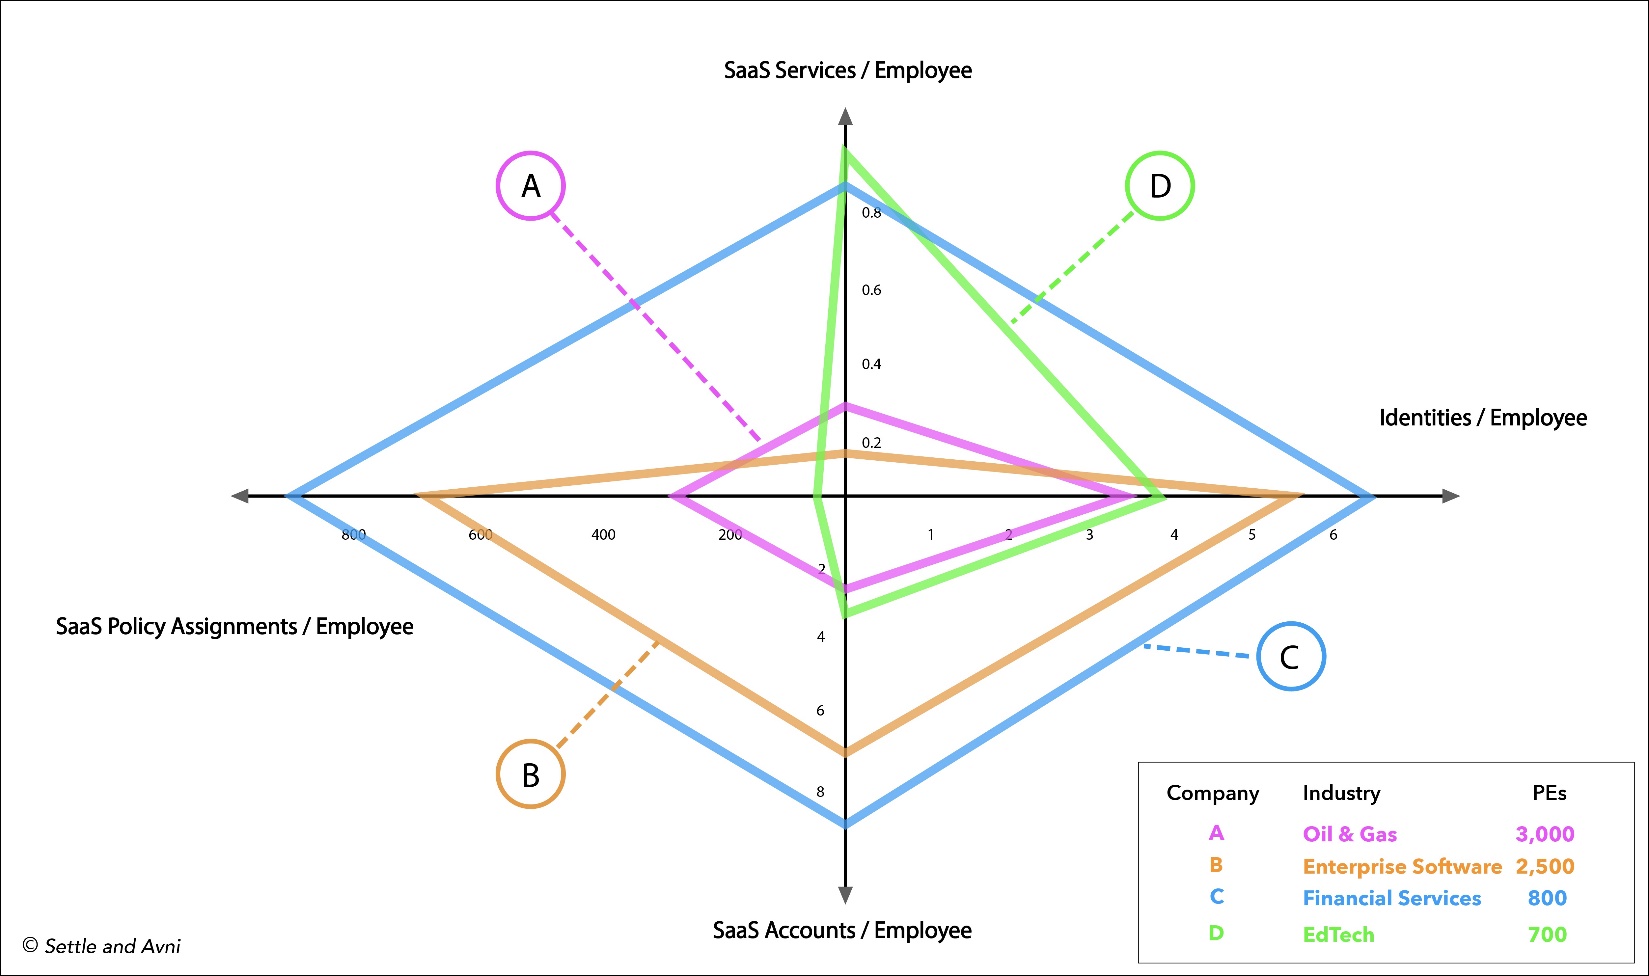
Figure 2. A SaaS sprawl diagram displaying the number of applications, user identities, user accounts and policy assignments within four different companies normalized to the number of paid employees within each company.
Company C has the largest footprint in this display, indicating that it is managing the largest overall collection of services, identities, accounts and policies relative to its paid employee workforce. In contrast, Company A has been dramatically more successful in restraining sprawl even though it’s more than three times the size of Company C. It’s also interesting to note that account creation and policy distribution has been significantly more modest in Company D than Company B although D is also three times larger than B. These observations suggest that provisioning procedures may be more stringent in larger companies – a hypothesis that merits further exploration in the future.
Other companies may find this display to be a useful means of gauging their effectiveness in limiting the administrative and security consequences of SaaS proliferation. This type of summary display might also be used to establish target ratios for curbing the creep of knock-on sprawl effects in the future.
The sprawl metrics displayed in Figure 2 were normalized to PE headcount in an attempt to compensate for company size, based on the presumption that larger companies are likely to have more services, identities, accounts and policies. These global ratios can be very misleading. For example, the ratio of unique SaaS accounts to PEs displayed in Figure 2 ranges from 2.1 to 8.4. In reality, many employees at these companies have been assigned to significantly more accounts than these numbers would suggest.
Selected individuals frequently possess a disproportionately large share of policies as well. 70% of the policies that Company C has assigned to its workforce are held by 25% of its PEs. The numerical distribution of accounts and policies across a company’s workforce is a direct reflection of the nature and rigor of its provisioning procedures. Such distributions should be reviewed on a regular basis.
As noted earlier, this study was exclusively focused on the use of SaaS services. The issues highlighted here would be exacerbated if IaaS services, accounts and policies were added to the metrics cited above.
Implications and opportunities
IT organizations have devoted considerable effort to automating SaaS provisioning procedures, delegating selected procedures to business teams and even, in some instances, providing end users with self-service provisioning capabilities. These initiatives have all been designed to minimize business disruptions and user inconvenience. Unfortunately, they all contribute to sprawl. The metrics discussed in this report suggest that equal effort needs to be devoted to automating the suspension or deletion of accounts and policies that are used infrequently or altogether dormant.
This study has investigated the sprawl created by the complete portfolio of SaaS services employed by individual companies. Similar studies could be performed on a narrower basis, specifically focused on services, accounts and policies that handle intellectual property (IP) or personally identifiable information (PII). In many instances it may be more important to curb the sprawl of SaaS knock-on effects that involve the use of proprietary knowledge or sensitive information than constraining the global growth of accounts and policies within an individual company.
As noted above, selected users may possess a disproportionate share of services, accounts and policies or they may possess a disproportionate share of resources that involve the handling of IP or PII. Login practices for such individuals should be customized to provide an extra measure of security protection. Users with the greatest exposure to IT resources should be subjected to the strongest authentication procedures upon initial login and additionally be required to respond to step-up or continuous authentication requests during extended work sessions. Security training programs should also be customized in ways that educate the most extensive authorization policy holders about the threats posed by the misuse of their credentials.
Vendors that provide tools for managing the assignment of SaaS accounts and policies to user identities have unique insight into the sprawl being experienced by their customers. Some aspects of this sprawl may be intentional, some may be unavoidable and other aspects may be completely unknown or unrecognized. Vendors with this insight should develop metrics their customers can use to track sprawl over time and, perhaps more importantly, provide customers with the ability to compare their sprawl profiles to other companies of similar size operating within the same industry and geography.
In the famous words of Peter Drucker: ‘what gets measured, gets managed’. SaaS sprawl is a pervasive phenomenon within modern enterprises that has gone unmeasured for far too long.
Special thanks to Authomize for providing the data employed in this study
Mark Settle is a seven-time CIO, three-time CIO 100 award winner and two-time book author. His most recent book is Truth from the Valley, A Practical Primer on IT Management for the Next Decade.
Tomer Y. Avni is an MS/MBA student at the Harvard Business School and the Harvard School of Engineering and Applied Sciences. He has served as an early-stage investor and advisor to startup firms and Fortune100 companies.